SWMMer: lightweight SWMM I/O and engine runner#
A numpy-only toolkit for EPA SWMM file and engine I/O.
swmmer builds a SWMM .inp, runs the EPA SWMM engine (bundled inside the wheel, so no
external dependencies are needed), and reads the binary .out results directly through
the EPA libswmm-output C library via ctypes. numpy is the only required
dependency.
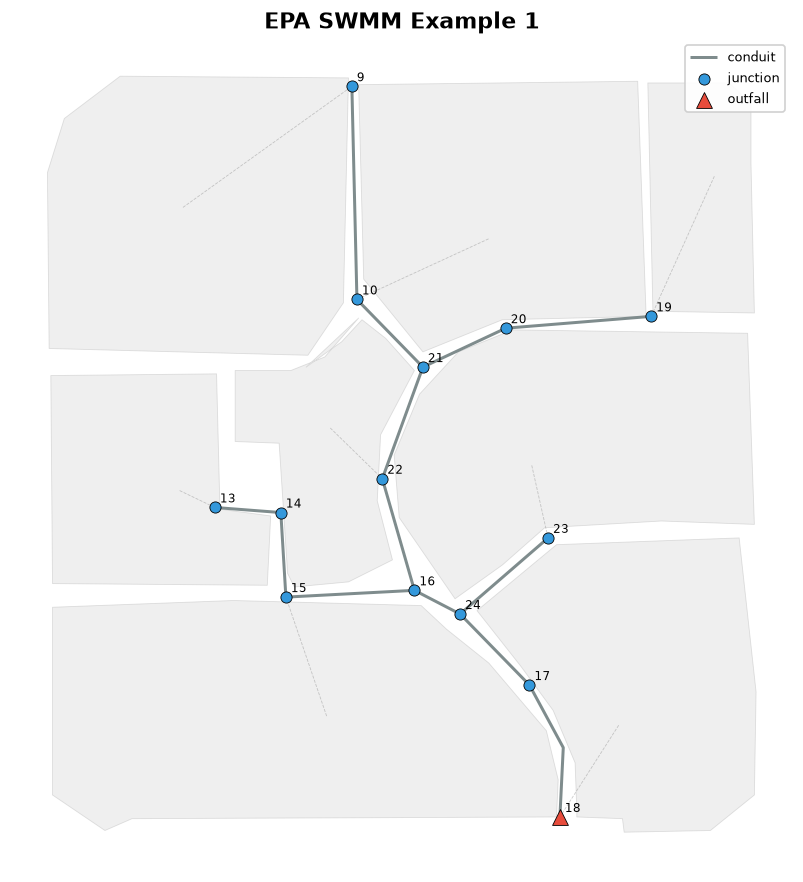
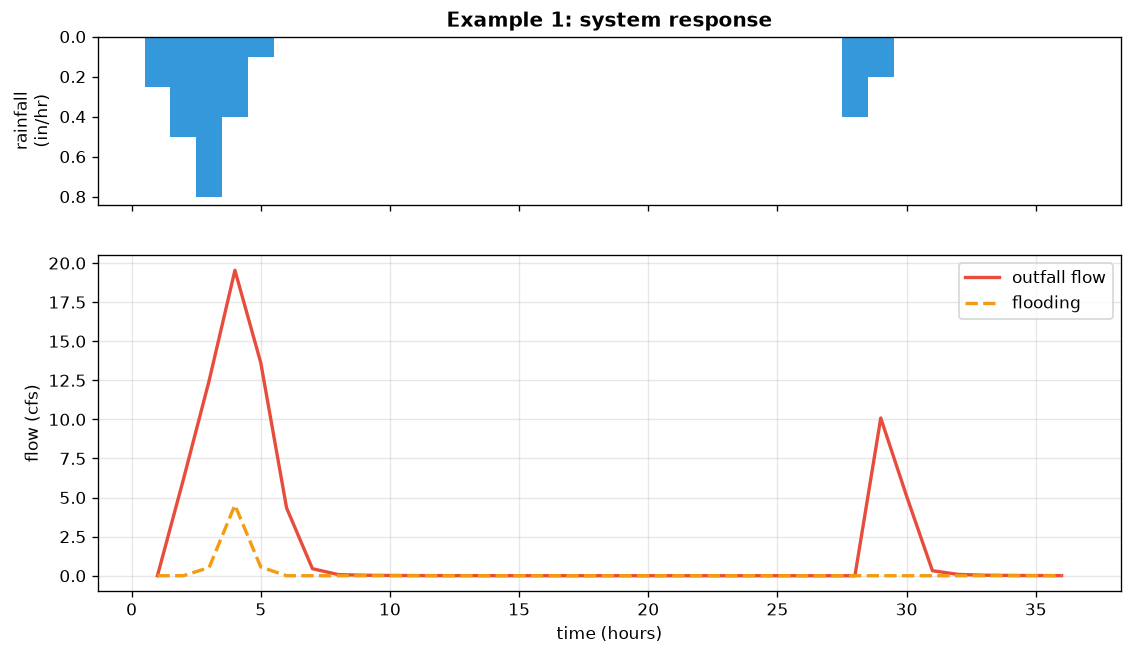
The EPA SWMM Example 1 network and its system response, both produced with swmmer:
Capabilities#
- Write input files.
SWMMInputGenerator, together with typed element defaults (junctions, conduits, subcatchments, storage, and more), assembles a valid.inp. - Build design storms.
build_nrcs_hyetographdistributes a total depth into an NRCS (SCS) Type II or Type III hyetograph, andwrite_rain_datwrites the SWMM rain file. - Run the engine.
run_swmminvokes the bundledrunswmmexecutable (also exposed as arunswmmcommand line tool). The engine is compiled into the wheel, so there is nothing to install separately. - Read results.
SWMMResultsreads the binary.outand returns NumPy arrays by element name and attribute (NodeAttr,LinkAttr,SubcatchAttr,SystemAttr), with optionalto_pandasandto_xarrayconverters. - Plot.
swmmer.plotdraws the network map and a longitudinal profile withmatplotlib, and can color elements by any result (peak flow, flooding, and so on).
Installation#
The SWMM engine (runswmm and libswmm-output) is compiled from source and bundled
inside the wheel, so pip install swmmer is self-contained on Linux, macOS, and
Windows.
Optional extras:
pip install "swmmer[plot]"           # matplotlib, for swmmer.plot
pip install "swmmer[pandas,xarray]"  # SWMMResults.to_pandas() / to_xarray()
Usage#
Build a design storm and write it as a SWMM rain file (pure and offline):
from swmmer import build_nrcs_hyetograph, write_rain_dat

hyeto = build_nrcs_hyetograph(150.0, storm_type="III", duration="24-hr")
write_rain_dat(hyeto, "rain.dat")
Run a model and read results by element name:
from swmmer import SWMMResults, SystemAttr, run_swmm

rpt, out = run_swmm("model.inp")
with SWMMResults(out) as res:
    t = res.times_hours
    q = res.system_series(SystemAttr.OUTFALL_FLOW)
Plot the network (requires the plot extra):
The example notebook in the documentation walks through the full workflow: run a model, plot the network, draw hydrographs and a profile, then analyze the results.
Contributing#
Contributions are welcome. Please see CONTRIBUTING.md for details.
License#
BSD 3-Clause License. See LICENSE for details.